Important: As of August 19, 2024, this page will no longer be actively maintained. Please refer to the current version of this content here.
Overview
PetBox is a fictional eCommerce company that sells monthly subscription boxes containing animal care products. In the accompanying PetBox app, subscribers can track and customize their monthly boxes, view their box history, and purchase specific products they liked from their boxes.
Recently, PetBox expanded their business by offering a line of branded webcams called PetCams that allow customers to monitor their cat’s behavior throughout the day. They’ve expanded the functionality of the existing PetBox app to accommodate this feature. Prior to the PetCam's launch, the app was only available to subscribers with a monthly box plan. Now, PetBox wants to explore how many non-box subscribers who downloaded the app for PetCam went on to become subscribers of a PetBox monthly box.
Question
At what rate do non-subscribers who downloaded the app convert to box subscribers over time?
Open the Cohort tool

Build the Query
- Define a Cohort: Select the event Download App. This includes any user who installed the app in our cohort.
- Select a Behavior: Select the event Subscribe. This will show us who among our cohort of app installers went on to subscribe.
- Select a Breakout: Let’s select the Time Generation Day of Download App. This will break out our results by grouping users together based on the day they installed the app.
- Run the Query.
We now have our basic cohort analysis results displayed as a table view.
- Looking at the rows, we can see the breakout of users grouped by day of app download.
- The columns tell us how long it took users to complete the target action after downloading the app. Since our time interval is Daily, the bolded numbers above each column represent how many days post-download the subscription was started. Above the columns and numbers is a miniaturized bar chart visualization displaying the average of results for each column.
- The bubbles indicate the percentage of a user group that completed the target action Subscribe and how many days after the cohorting action Download App they did it.
We can modify our analysis using the options in the grey toolbar at the base of the query builder, as well as by using additional events or properties to create clauses. Let’s modify our cohort.
Modify the Cohort
- Once the basic cohort analysis has been created, we can go back into the query builder and modify it to fine-tune our results. Currently, our cohort includes all users who downloaded the PetBox app. However, to answer our initial question “At what rate do non-subscribers who downloaded the app convert to box subscribers over time?”, we only need to see non-subscribers who took this action. We can achieve this by adding a “Where” clause to the first row in the query builder, which defines our cohort of users.
- Hover underneath the Define a Cohort step and select filter where, then choose the User Properties tab and select the property Subscription Plan.
- Finish out our parameters by setting the “Where” clause to “is equal to None".
Our new group only includes users who completed Download App and who were not subscribers.
Select Between First Time and Recurring
For the purpose of our analysis, we only need to know about the first time a user subscribed after downloading the app. Selecting “First Time” will limit our results to only show the first time this event was performed.
View Results
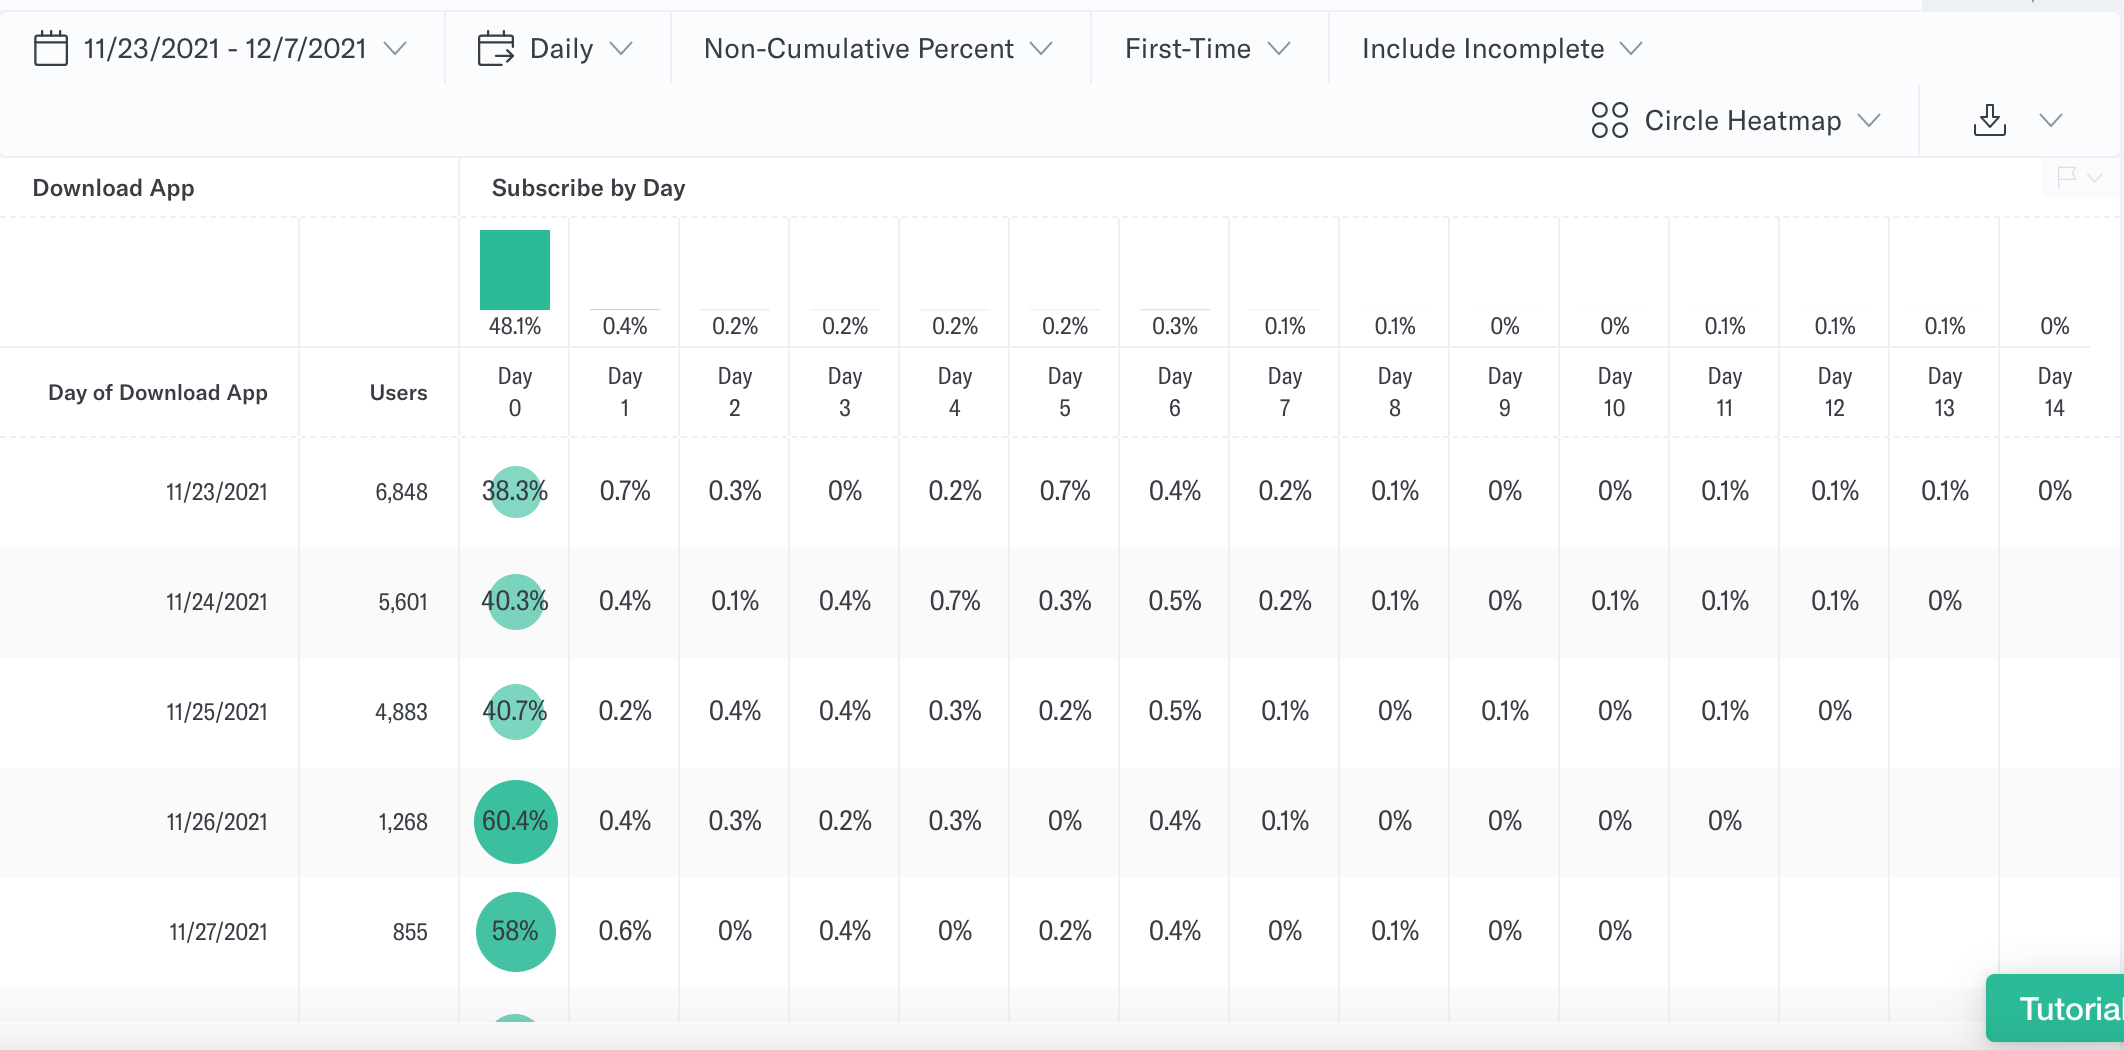
Our cohort analysis now shows us the rate at which non-subscribers who downloaded the PetBox app are converting to subscribers over time.
Observation
While there are strong conversion numbers within the first day of app download, conversion drops dramatically after the first day. PetBox should create ongoing promotions for new app users to incentivize box subscriptions.
We are currently viewing our analysis results as a non-cumulative percent. There are a few other options we can use to view our results:
-
Cumulative Percent: In this view, percentages represent a running total of the percentage of the cohort that subscribed over time.
-
Non-Cumulative Count: This view shows us the same results as our default view. However, the numbers displayed represent a raw count of users who subscribed on a given day, rather than a percentage.
-
Cumulative Count: In this view, results are viewed as a running total of the raw count of users who subscribed over time.